Long Island Sound Sentinel Monitoring for Climate Change Program
Entering metadata into the Long Island Sound Sentinel Monitoring Geospatial Database
Welcome to the Long Island Sound Sentinel Monitoring Geospatial Database tutorial with instructions on how to enter metadata about existing and historic research and monitoring programs. What you will learn in this tutorial:
- database overview
- page orientation
- login page
- sentinel site database utility - data entry form
- edit a record
I. DATABASE OVERVIEW
The purpose of the database is to capture information (metadata) about research or monitoring data sources that are or could be part of monitoring programs to detect changes to in the environment from climate change. The primary audience of the data clearinghouse is scientists and resource managers. The primary purpose of the site is to provide access to information about data collected in LIS that may speak to climate change in the marine and coastal ecoregions. It will facilitate synthesis of LIS related data in the context of climate change and sentinel monitoring through an on-line interactive database of historic, current, and emerging research.
Before entering metadata, please consider how the database records will be used:
- the database is intended to compile information about all applicable research and monitoring pertaining to climate change in Long Island Sound; the more comprehensive this directory, the easier it is to identify the monitoring network
- the database will be analyzed to identify similar monitoring types in order to determine if there are sufficient monitoring to provide adequate regional coverage
- for a particular indicator, is there adequate spatial coverage and are the data collected in a way such that the data are compatible to detect regional trends?
- the above analysis might lead to the standardization of data collection for particular indicators
- the database can be used to identify spatial gaps
- database records can be used for the following:
- identify data at risk of being lost
- development of metadata details (the database is intended provide an summary of the metadata but not serve to replace a formal metadata document)
- identification of gaps in climate change indicators (both in terms of spatial gaps for existing indicators and the need for additional indicators)
- missing records for known monitoring programs - help SentinelSentinal Monitoring workgroup to identify priorities for contacting programs/individuals to compile the metadata record for missing programs and
- database may be used to encourage collaboration among researchers and to avoid duplication of existing initiatives.
Keeping in mind how the database will be used, please endeavor to provide as much specificity as possible in your record(s).
II. PAGE ORIENTATION
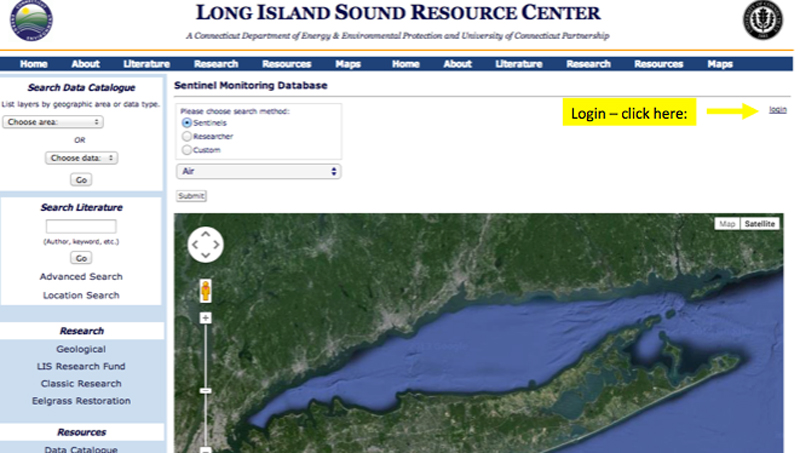
The following is a snapshot of the database page highlighting the login location in the top right of the window. Click “Login” to access the Login page.
III. LOGIN PAGE
NOTE: To enter metadata into the database, you must request a user name and password from the Connecticut Department of Energy and Environmental Protection. Current contact information is provided on the Login Page as shown in the snapshot below. Enter Username and Password and click the Login button.
Users can only edit the records they created. The use of passwords protects records from being edited by unauthorized users.

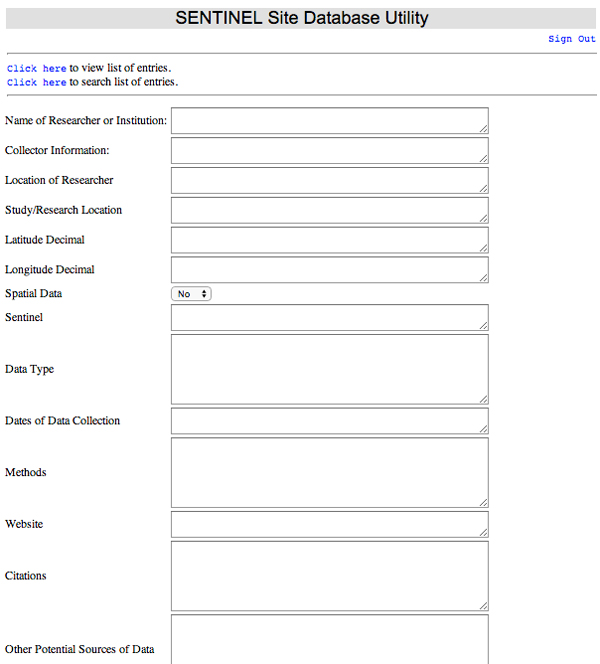
IV. SENTINEL SITE DATABASE UTILITY - ADD A RECORD
This is an online form to facilitate the entry of information (metadata) about existing or historic research that might support monitoring of the potential changes to Long Island Sound health habitats, species and processes resulting from climate change. A snapshot of this page is below. What follows the page view is a list of the field names and the type of information request for each field.
Ideal records provide information in all fields and do not direct user to a website for details. In such cases a summary are needed so that the reader can grasp what is being measured and how it is being measured. Details should be in a formal metadata document.
At this writing, database entries are restricted to data/monitoring about the approved list of sentinels. Please consult this list to[1] be certain that research/monitoring information to be entered in the database is an approved Sentinel. If a sentinel is not listed, there is a process for updating the LIS Sentinel list.
A. Name of Researcher or Institution
Provide the Name of the Researcher, Monitoring Program Principal or Institution and contact information.
B. Collector Information
Provide information about the program that has collected the information if it is not the originating program/researcher. Include email and phone number. Here is an example:
- Peter Auster rescued the lont-term temperature and salinity records collected at the Noank Marine Laboratory. Jim O’Donnell has digitized the data and these data are now available through LISICOS. The data are accessible at LISICOS.
C. Location of Researcher
Provide address for researcher/program.
D. Study/Research Location
There are two required pieces of information for this field:
- study - provide a descriptive name for the type of research/monitoring
- research location - provide a description of the research location
Searching the database returns the name of the research and the study/research location. This is why it is so crucial to provide the above information. Providing location information does not help the user understanding the type of research/monitoring without examining the full record.
Wherever possible be specific about the location (e.g., Fishers Island Sound, Little Narragansett Bay, central Long Island Sound). Some monitoring locations are coast wide such as colonial water bird surveys and so the location is CT Shoreline (beaches and islands).
E. Latitude Decimel
The database will create a point location on the google map using the listed latitude and longitude. The format must be decimal degrees such as 40.9594 for latitude. There are many online latitude and longitude converters.
Note to reduce ‘map clutter’, monitoring/research that occurs at multiple sites such as the Long Island Sound Water Quality cruise surveys (26 sampling stations) are listed as a single location. In cases such as this, in field G (Spatial data) - select yes. The map will display the point (marker) in red. Single stations are displayed in blue.
F. Longitude Decimel
Enter the longitude in decimel degrees using the following format: -72.0314.
G. Spatial Data
This field defines whether the site is question represents a single station (marker color blue) versus multiple stations collecting the same data at all stations (marker color red). An example of the latter would be the LIS Water Quality Cruise data that collects the same data at 26 fixed locations in the Sound. In this example, the user would select yes to indicate that a single red point/marker represents many stations where the same data are collected.
H. Sentinel
Select the LIS Sentinel(s) from the list found at: provide URL to list[2] .
I. Data Type
Data type refers to the units of the data (e.g., degrees F, degrees C, mg/l).
J. Dates of Data Collection
Report the dates of data collection. For long-term monitoring programs describe the beginning date and summarize the frequency of sampling (e.g., biweekly collection of certain indicators but monthly collection for supplemental data observations).
K. Methods
Describe the methodology and be as specific as possible. Here is an example:
- Forest vegetation transects - Contiguous 3m X 3m quadrats are established on both sides of the transect line along the entire length of each transect. Presence data were recorded for shrub and herb species in these quadrats. Composition and abundance of trees is determined for 15.2 meter sections of the transect. Species and diameter (at breast height) of all trees were recorded in the 6m X 15.2m quadrats. Density, basal area and frequency of all trees are calculated. Importance Values were calculated.
L. Website
Give the URL (if available) to the website that contains information about the research or monitoring programs described in this record.
M. Citations
List publications that describe the research/monitoring programs for this record. Give URL’s where appropriate.
N. Other Potential Sources of Data
List other potential sources of data if they exist.
O. Submit
Click on the submit button to enter data into the database. The submit action submits the record to the database and a new screen is displayed which allows the user to attach a document to the record. The primary purpose of this field is to add geographic information about sites will have multiple monitoring stations. Typically this will be a GIS file such as an ESRI files (e.g.,shapefile such as .shp, .shx and .dbx) or Google Earth file (e.g., KML). The upload only permits the loading of a single file at a time. In the case of ESRI files it is recommended that the user save the files in an archive and upload the archive file. It is recommended that a screen capture of the GPS display be included as .jpg image file. This will allow for a quick view of the station distribution in the users browser.
The following image is a snapshot of the upload page. In this example two files have already been uploaded. To add a file select the choose file button and navigate to the directory containing the image to be uploaded. Once the file is selected, select the upload file.
If additional files are to be uploaded, return to the record and scroll down the page to the submit button - this will return the user to the upload page.
Upload errors may be encountered if the file extension is not recognized by the database.
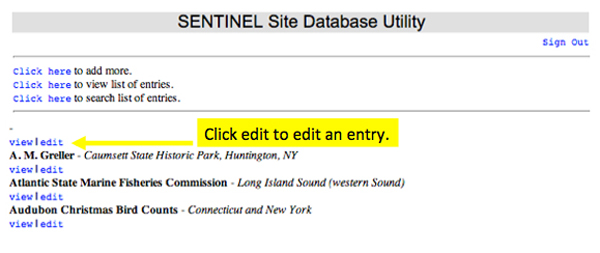
V. EDIT A RECORD
To edit a record click the “view list of entries link” which generates a list of entries. Locate your record and click on the edit link. This will return you to the database utility form which contains the data you entered into the record. Complete your editing by clicking on the submit button at the bottom of the page.
.
|


